
[SHOPIFY data analysis] What are the important indicators and analysis methods for improving sales?
Site analysis is indispensable to increase sales in operating EC sites.
In Shopify, you can use the "SHOPIFY Store Analysis" to analyze the data of the site.
This time, we will explain important indicators and analysis methods in data analysis.
What can be realized with the "store analysis" function
With the Shopify store analysis function, if you open the page, the data will be up to date within about 1 minute. You can display new data by reopening the dashboard or updating the browser page.
In Shopify's store analysis function, you can mainly see the following data.
- Total sales
- Conversion rate
- Top products by sales unit
- Number of sessions by traffic
- Average order unit price
- Percentage of repeaters
- Total order
Store analysis method
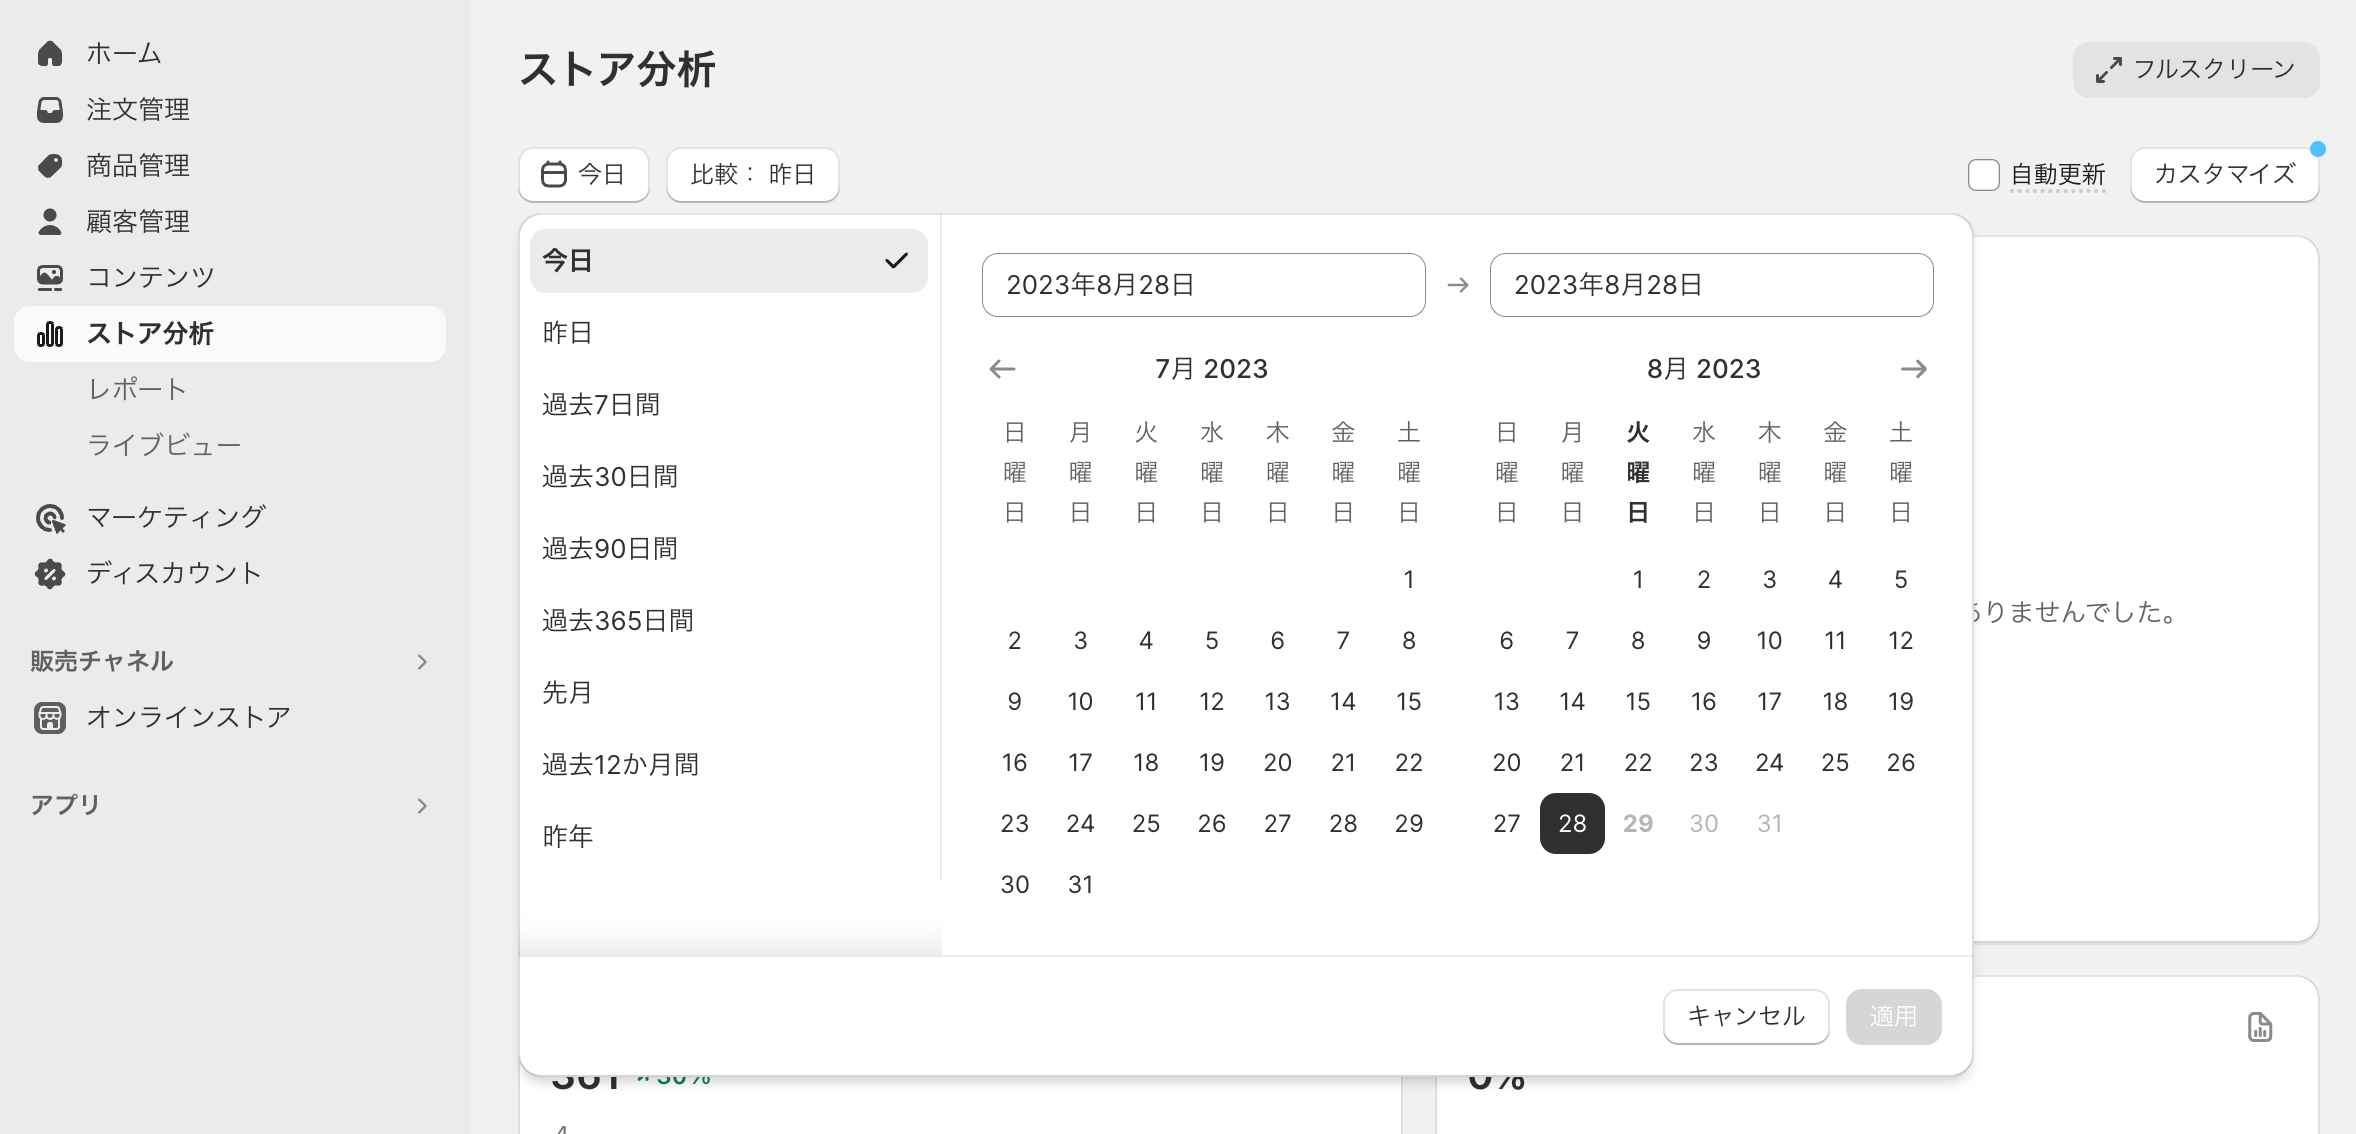
1. From the management screen "Store analysis"Go to. The dashboard allows you to compare the data of the previous day with today's data.
2. To display the data in another date range, click the date menu and select another date range. It is also possible to select a range such as the past 30 days or to set the custom range by clicking on the calendar date.
3. When editing the indicators displayed on the dashboard,"Edit an overview" Click. When deleting a report, it is next to the report to delete "X"Click. It is also possible to drag and drop indicators from the sidebar to the overview and add a report.
lastly"Application"Click.
Index seen on the dashboard
The dashboard displays 16 data data. (18 items if POS is linked)
First, I will explain "session" and "visitors".
session:The number of sessions and the number of visitors is based on cookies.
The session ends 30 minutes after the activity is gone or at 12:00 on the UTC. The number of sessions is usually higher than the number of visitors because the same visitors can have multiple sessions.
Visitor: User who visited the store
・ Average order amount
The average amount of all orders (excluding gift cards) is displayed by the total number of orders that include one or more items other than the gift card.
This amount is useful to know how much the store tends to be spent and to understand the price policy.
・ Conversion rate
The ratio of the session connected to the order is displayed.
The ratio of "added to the cart", "reached check -out", and "number of sessions linked to conversion" based on the total number of online stores.
※This indicator is for online store channels only.
・ Session of online store by device type
The number of sessions at the online store and the types of devices used to access the store are displayed. The most common device types are mobile, desktops and tablets.
※This indicator is for online store channels only.
・ Session of online store by location
The number of online stores sessions is displayed by country.
※This indicator is for online store channels only.
・ Traffic Moto separate online store session
The number of sessions in the online store is displayed based on the methods accessed by the visitor.
Sessions will occur when you search or enter the URL of the store directly. The most common traffic source is search, direct, social, and email.
※This indicator is for online store channels only.
・ Number of online stuffing sessions by social sources
The number of sessions in the online store that occurred from SNS sources such as Facebook, Instagram, YouTube, Twitter, etc. is displayed.
※This indicator is for online store channels only.
・ Repeater rate
The percentage of customers who ordered multiple orders in the store is displayed. This rate is calculated by dividing the repeater by the total number of customers.
・ Sales by social source
The amount of sales generated through access from SNS sources such as Facebook and YouTube is displayed.
・ Sales by POS location
If there is one or more active POS location, the sales amount generated in each POS location will be displayed.
・ POS sales by staff
If there is one or more active POS location, the amount of POS sales processed by each staff will be displayed.
・ Traffic source sales
The amount of sales via each traffic source is displayed. Traffic from search, direct, social, email, etc. is common.
・ Top landing page
Displays the page inside the site that users first accessed.
If you publish a blog post in SEO measures, you can analyze which page is flowing from which page and consider the conductor to purchase the product.
※This indicator is for online store channels only.
・ Top products by sales unit
The best -selling product in the store is displayed.
Useful for product inventory management and promotion.
・ Top reference source by session
Displays the number of sessions accessed directly from other websites and the top five websites. "Search", "direct", "social", "email" are not included.
※This indicator is for online store channels only.
・ Total online store sessions
Displays the total number of online stores and the total number of visitors.
※This indicator is for online store channels only.
・ Total number of orders
The sales amount will be displayed by sales channel. The total sales are calculated by "Total Sales High -Discount -Return + Delivery fee + Tax".
・ Sales caused by marketing
Displays the number of orders and total sales generated by access that may be the result of marketing.
・ Sales caused by marketing
Displays the number of orders and total sales generated by access that may be the result of marketing.
・ Customer group analysis
The percentage of customers who returned the store and repeatedly purchased the store is displayed.
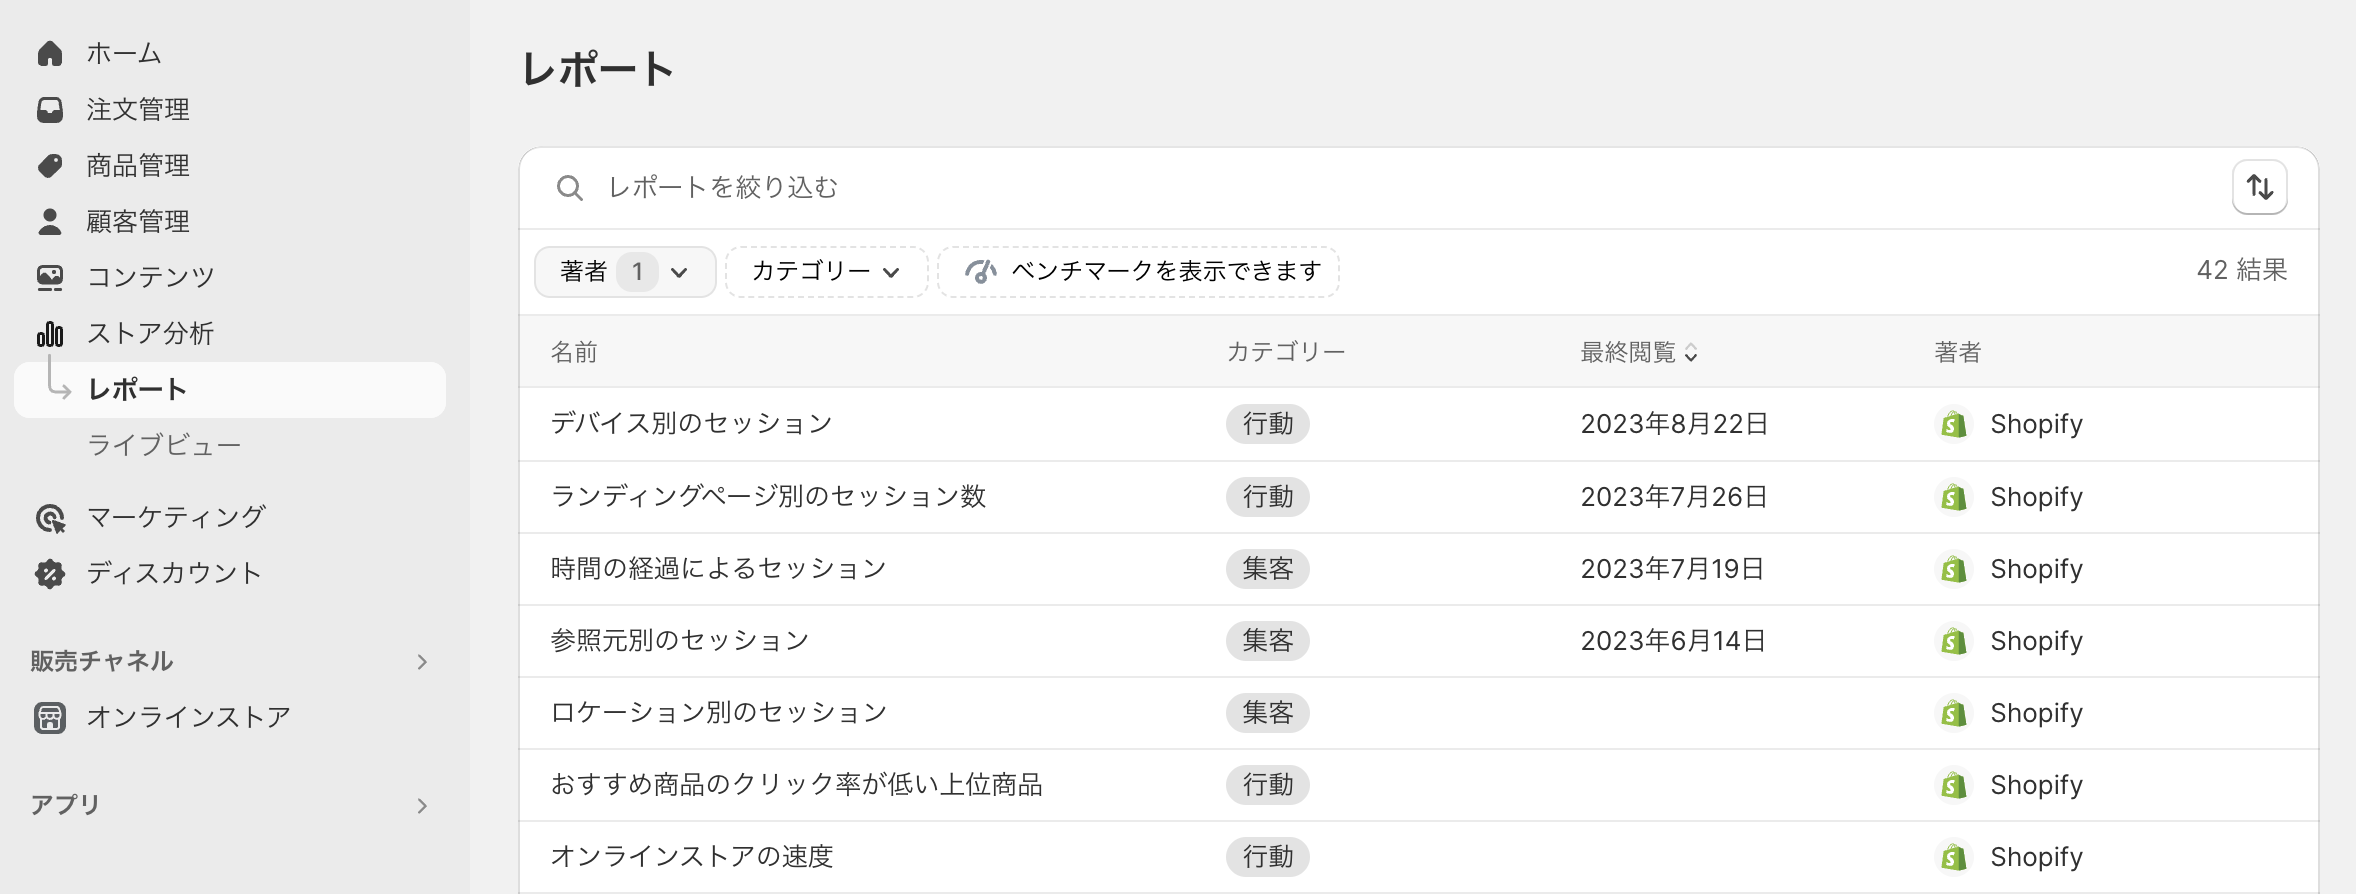
About reports
In the report, you can analyze store data more finely.
You can check many indicators, but there are restrictions on report items that can be used depending on the plan.
・ Financial report
Financial reports can be used in all plans, and it is possible to analyze financial information such as sales, returns, and taxes.
You can see the following data.
・ Financial summary
・ Total sales
·tax
・ Hint
·settlement
・ Report of customers
The report of customers can be used with a basic plan or more, and you can see the following data.
・ Session over time
・ Session by reference source
・ Session by location
・ Inventory report
The inventory report can be used with a basic plan or more, and you can see the following data.
・ Sales inventory rate
・ ABC analysis by product (standard plan or above)
・ Average sales in stock per day
・ Stock snapshot at the end of the month
・ Inventory value at the end of the month
・ Action report
The action report can be used with a basic plan or more, and you can see the following data.
・ Conversion of online store over time
・ Top online store search
・ Substantial online store search that cannot be obtained
・ Changes in recommended products accompanying time
・ Number of sessions by landing page
・ Session by device
・ Online store cart analysis (standard plan or above)
・ Online store speed
・ Marketing report
Marketing reports can be used for a basic plan or more, and you can see the following data.
・ Number of sessions caused by marketing
・ Sales caused by marketing (standard plan or above)
・ Conversion by first interaction (standard plan or above)
・ Conversion by last interaction (standard plan or above)
・ Comparison of attraction models (standard plan or above)
・ Order management report
The order management report can be used for a standard plan or more, and you can see the following data.
・ Orders for the passage of time
・ Product orders and returns
・ Full film over time
・ Full -file, delivery, delivery office required
・ Sales report
Sales reports can be used for a standard plan or more, and you can see the following data.
・ Sales over time
・ Sales by product
・ Product variations SKU sales
・ Sales by product sales source
・ Sales by discount
・ Traffic reference source sales
・ Sales by location location by location
・ Channel sales separately
・ Sales of customer names
・ Average order amount over time
・ Retail sales (POS) report
Retail sales reports can be used by contracting for the standard plan and adding a "Point of Sale" sales channel.
・ Retail sales by product
・ Product variations SKU Retail sales
・ Retail sales by source of product
・ Retail sales by product type
・ Retail sales by POS location
・ Retail sales by register staff
・ Retail sales by register staff (every day)
・ Retail sales by staff who supported sales
・ In profit ratio report
The profit margin report can be used with a standard plan or more, and you can see the following data.
・ Products by product
・ Product variations SKU separate profit
・ Profit by POS location
・ Customer management report
Customer management reports can be used for a standard plan or above, and you can see the following data.
・ Number of customers over time
・ Comparison of new customers and sales to repeaters
・ Customers by location
·repeater
・ One -time customer
・ Customers with risks (premium plan or above)
・ Royal customer (premium plan or above)
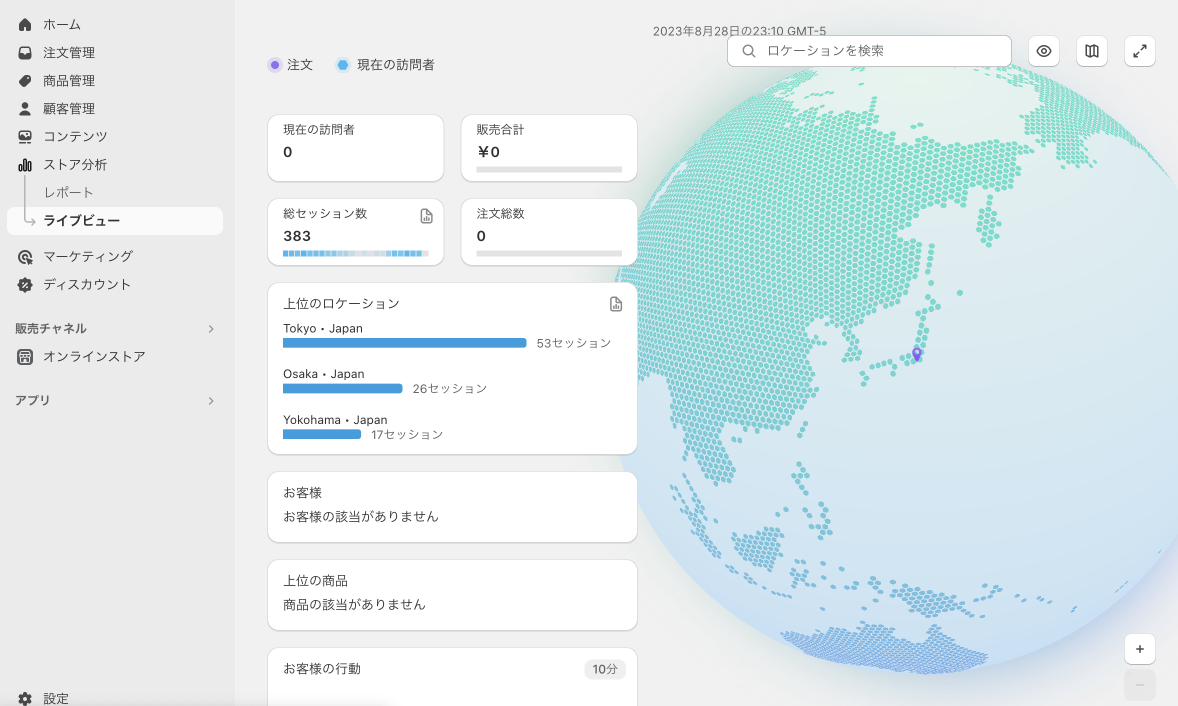
About live view
In the live view, you can check the access to the online store and the user's behavior in real time.
You can use live views to see online store activities and all channels sales. This is especially useful when you want to see the most traffic, such as Black Friday Cyber Monday, or want to see the immediate results of marketing activities, discounts, and other promotions.
lastly
This time, we explained the views and indicators of "dashboard", "report", and "live view" that can be used with Shopify's default function.
SHOPIFY can also use other analysis tools such as heat map tools and Google Analytics.
Please use the following articles at the same time!


![[Part 1] What is SHOPIFY's metallic? Explanation with procedure up to how to implement it with no code](http://goriderep.com/cdn/shop/articles/metaobject-how-to_50f6f959-d8af-4090-a5d3-06c9d17c93d4_400x.png?v=1722825848)


We provide a one-stop service from e-commerce site development to ad management.
At GO RIDE, a certified Shopify Plus Partner and Google Ads agency, we provide Shopify e-commerce site development and ad management services. Please feel free to contact us.


Other articles
View all


