
Leave the access analysis report creation! How to use Google Data Studio [Template available]
What is Google Data Studio?
Google Data Studio
 https://cloud.google.com/data-studio/?hl=ja
Google Data Studio (Google Data Studio) is a free BI tool.
If you have a Google account, you can use it online immediately.
https://cloud.google.com/data-studio/?hl=ja
Google Data Studio (Google Data Studio) is a free BI tool.
If you have a Google account, you can use it online immediately.
What you can do in Google Data Studio
〇 Creating reports by consolidating multiple data
You can create and visualize the required data from multiple data.
Collective data Google Analytics, Google Spreadsheet, Google AdWords, Atlife 360, BigQuery, Cloud SQL, MySQL, YouTube analytics, etc.
〇 Dashboard that can be used non -plastic
The items prepared in the sample are set in advance, so you can easily create a graph.
Sample ten plate Google Analytics, Google Search Console, Google AdWords, YouTube Analytics, BigQuery, Google Sheets, etc.
〇 You can easily share
You can choose a shared method according to the situation, such as shared with URL only, approval of account itself and shared (browsing only / editing).
〇 Images can be added to the report
Images such as logo and icons can be used, so you can create more original and visible reports.
How to use Google Data Studio
To create a report in Data Studio, you need a Google account linked to Google Analytics. You cannot get data unless you open it with a common account. 1. Create a new data source to be extracted. For the first time accessing the data, press the approval button.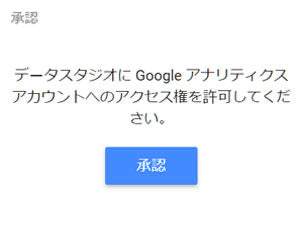 2. The approved data is displayed. Select and press the connection button.
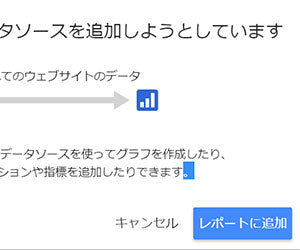
 3. This screen will be displayed, but press the report creation button.
 4. Press the addition button to the report.
 5. Select a graph and drag the cursor (move +) to extract the data set by default.
You can create an original report using "data" and "style" on the right if necessary.
5. Select a graph and drag the cursor (move +) to extract the data set by default.
You can create an original report using "data" and "style" on the right if necessary.

Google Data Studio report features
・ It is a function in the analytics report, but when the cursor is combined, the values for each day are displayed.

・ Filtering is possible by date and category, and the filtering function is convenient compared to analytics, and the display is easier to understand.

template
 Created as a sample of analytics + console report!
Please use it freely from this link. (For editing, login is required for Google account)
https://datastudio.google.com/open/1q310HZSAx6XRhNnbdc8sRg_qFzMxoBqg
Created as a sample of analytics + console report!
Please use it freely from this link. (For editing, login is required for Google account)
https://datastudio.google.com/open/1q310HZSAx6XRhNnbdc8sRg_qFzMxoBqg
important point
Only online data is shared and there is no printing function. However, the browser printing function can be used and can be converted to PDF.
summary
Google Data Studio can work online with Google accounts and easy to share. In addition to the web analysis report, you can also visualize documents, so how about making materials?Go Ride creates and analyzes data reports after the site production (site in the operation phase). Please feel free to contact us. For inquiriesHere


One -stop offered from EC construction to advertising operation.
Go Ride, a SHOPIFY official expert "SHOPIFY PLUS PARTNER", and Google Advertising "Google Partner", "Google Partner", we have built, develop and develop e -commerce sites on SHOPIFY. Please feel free to contact us.


Other Articles
View all


![[Video available] GO RIDE Engineer Remote Work 1 day](http://goriderep.com/cdn/shop/articles/frame-16_400x.png?v=1712635408)